Registration
The first step is to register to SOFIA HR by following the instructions of Picture 1.
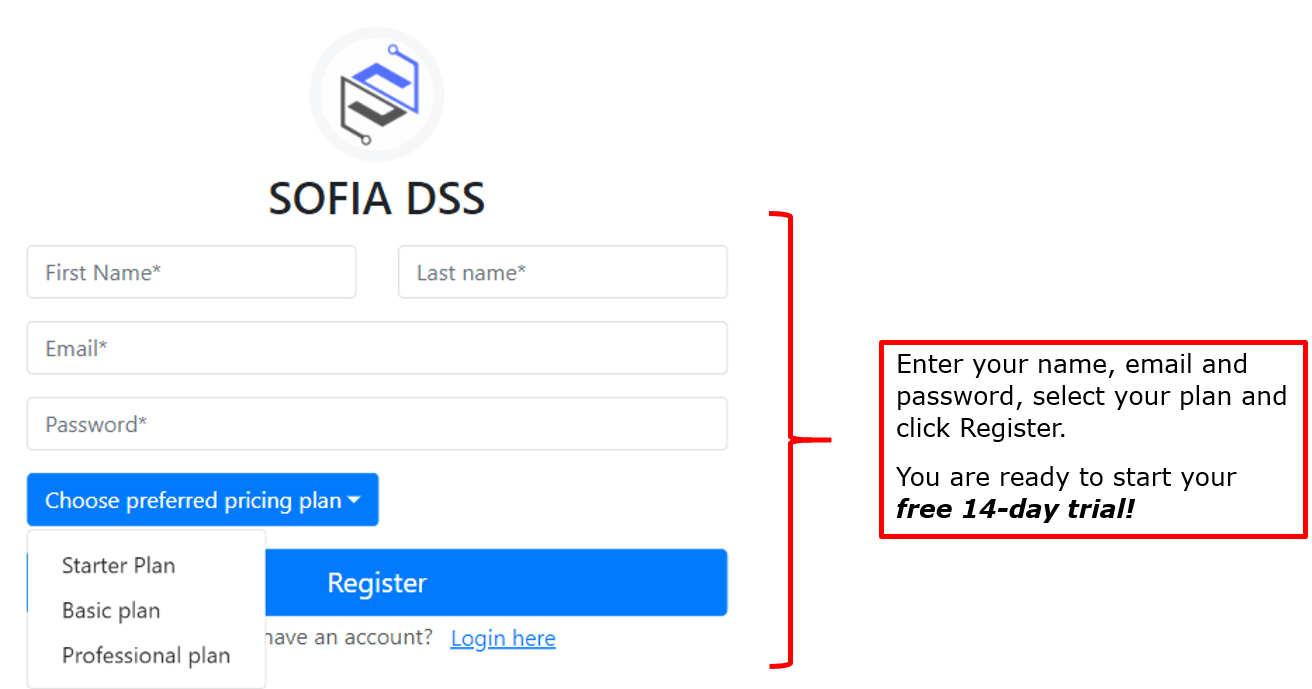
Picture 1: SOFIA HR Registration Page.
Home Page
Picture 2 represents SOFIA HR Home Page in which you have access to all functionality.
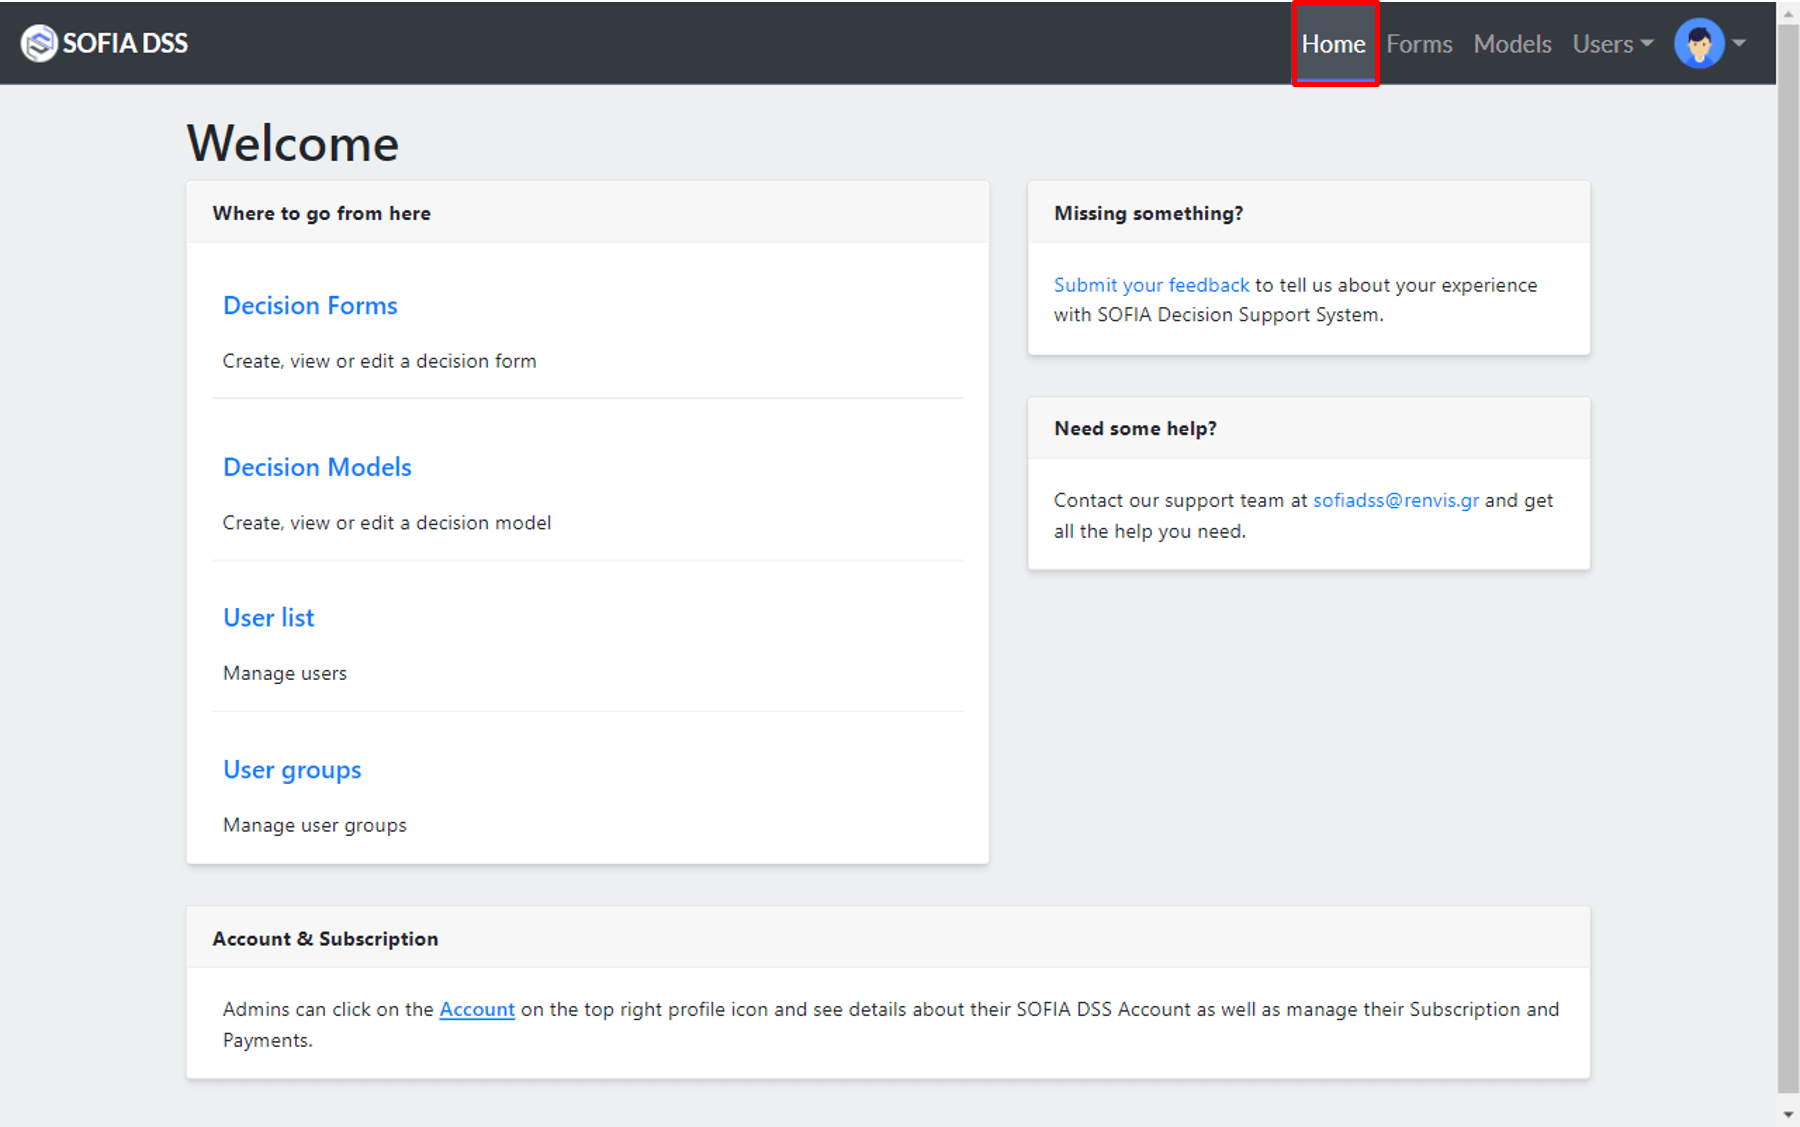
Picture 2: SOFIA HR Home Page.
Manage User Groups & User Lists
You can initially create “User Groups” to group your users by following the steps 1 to 4, as shown in pictures 3 and 4 and then create “Users” by following the steps 5 to 8, as shown in pictures 5 and 6. The user groups, may be the departments of your company while the users, the managers of each department. Keep in mind that a user must be a part of at least one user group.

Picture 3: Add New User Group.

Picture 4: Create User Group.

Picture 5: Add New User.
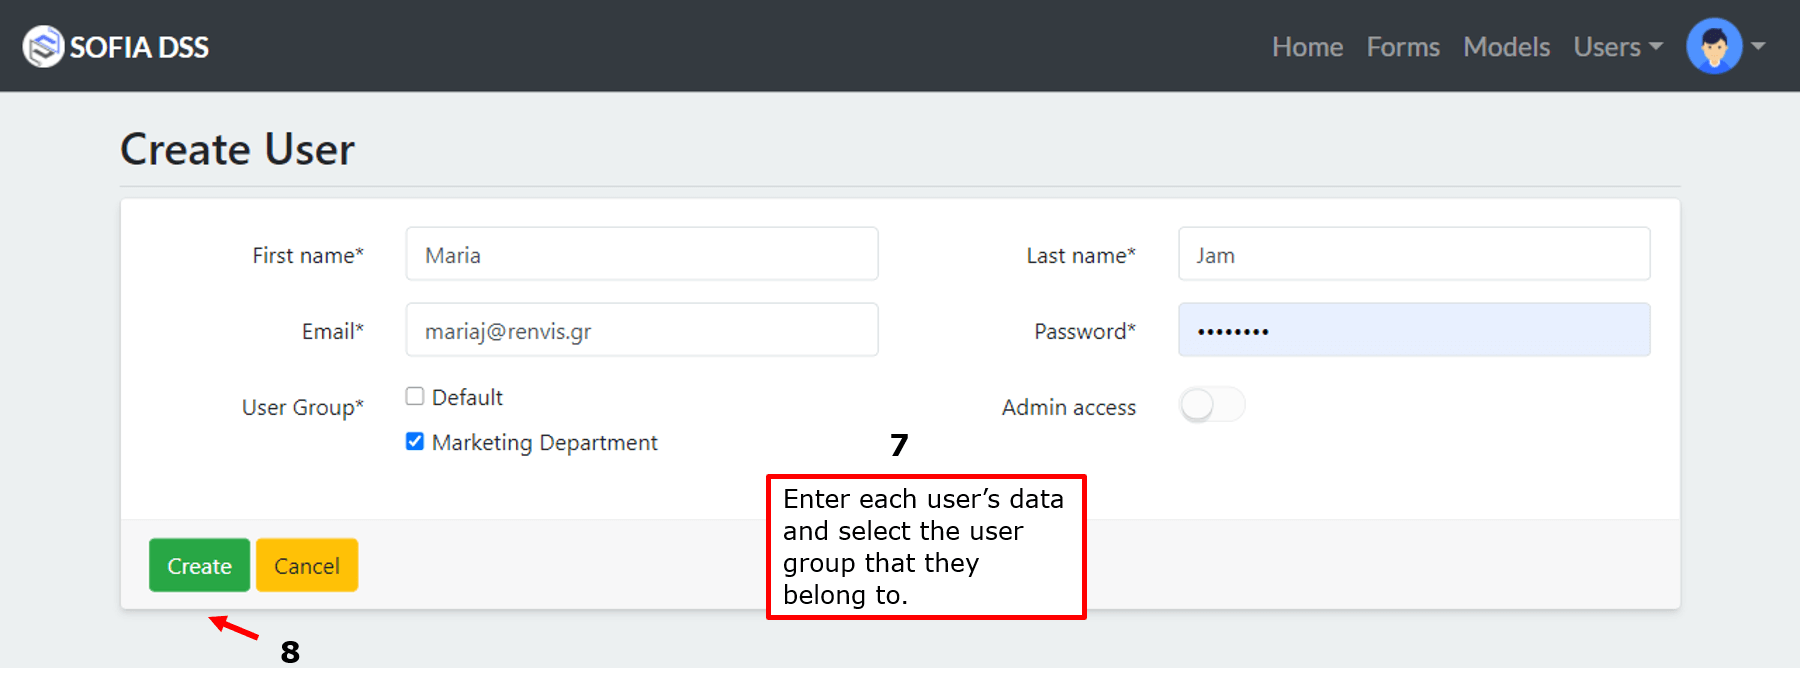
Picture 6: Create User.
Create Decision Models
Let’s start by creating a Decision Model, by following the steps 1 to 8, as shown in the pictures 7 and 8.
A decision model is a customized template for a specific case of a company. It has a number of factors that each of them carries a weight, that determines its importance relatively to the other factors in the model.
There are 2 models created by default, which are our suggestions for Employee Evaluation and Employee Recruitment. You can view, edit, duplicate and delete them, by using the icons next to the models, in order to adjust the models to your company’s needs.
You have to decide the weight of each factor, depending on the significance of its impact, concerning the final decision.

Picture 7: Add New Decision Model.
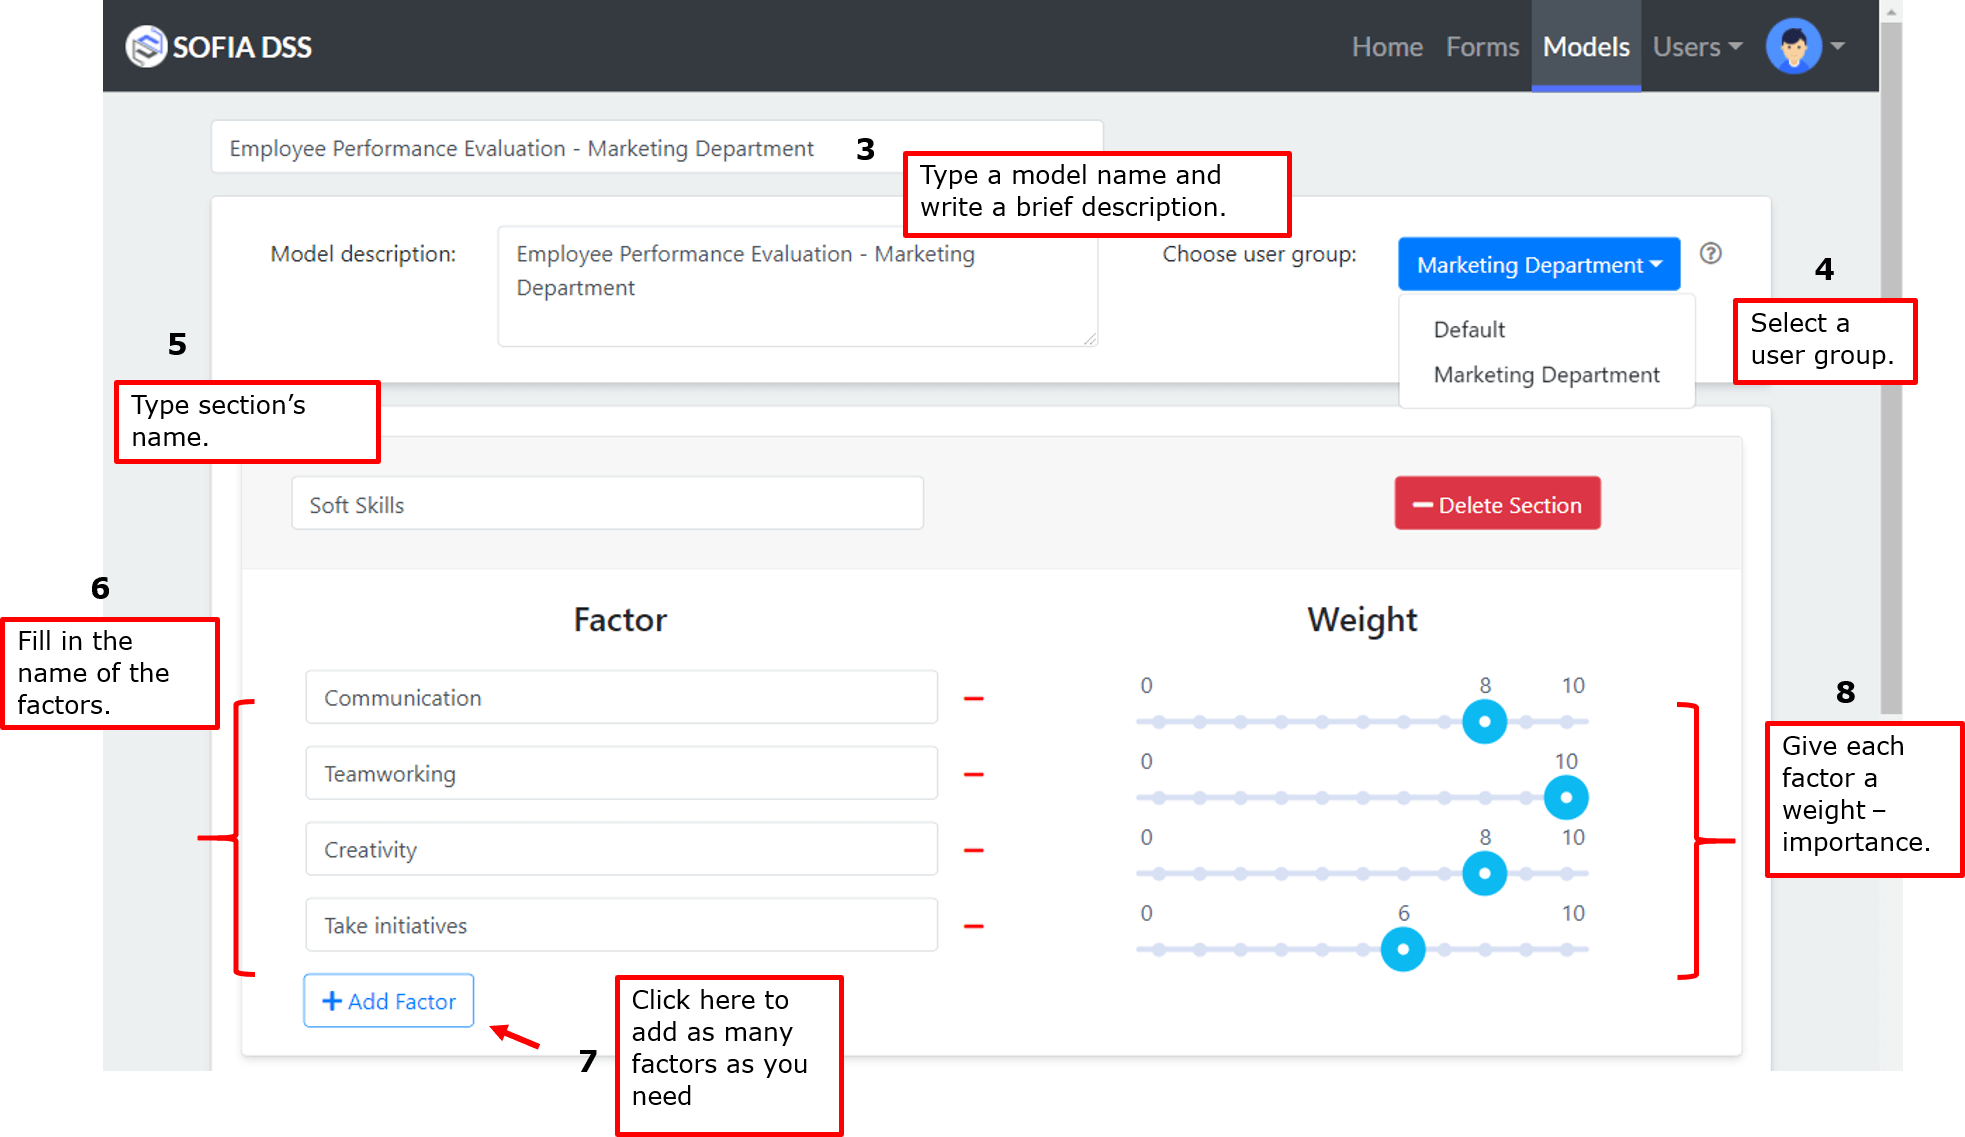
Picture 8: Create Decision Model.
When you finish the 8th step, scroll down, add as many sections and factors as you need and click “Save Model”.
If you have saved the model and you need to edit it, click the ‘eye-like’ button next to the model, and then “edit” and “update”.
Create Decision Forms
Now that you have successfully finished creating your first model, it is time to create some Decision Forms that use it. All you need to do is to follow the steps 1 to 5 of pictures 9, 10 and 11 and create your first Decision Form. The “model” is a template we use to evaluate an employee for example, while the “form” is the actual evaluation.

Picture 9: Add New Decision Form.

Picture 10: Choose a Decision Model.
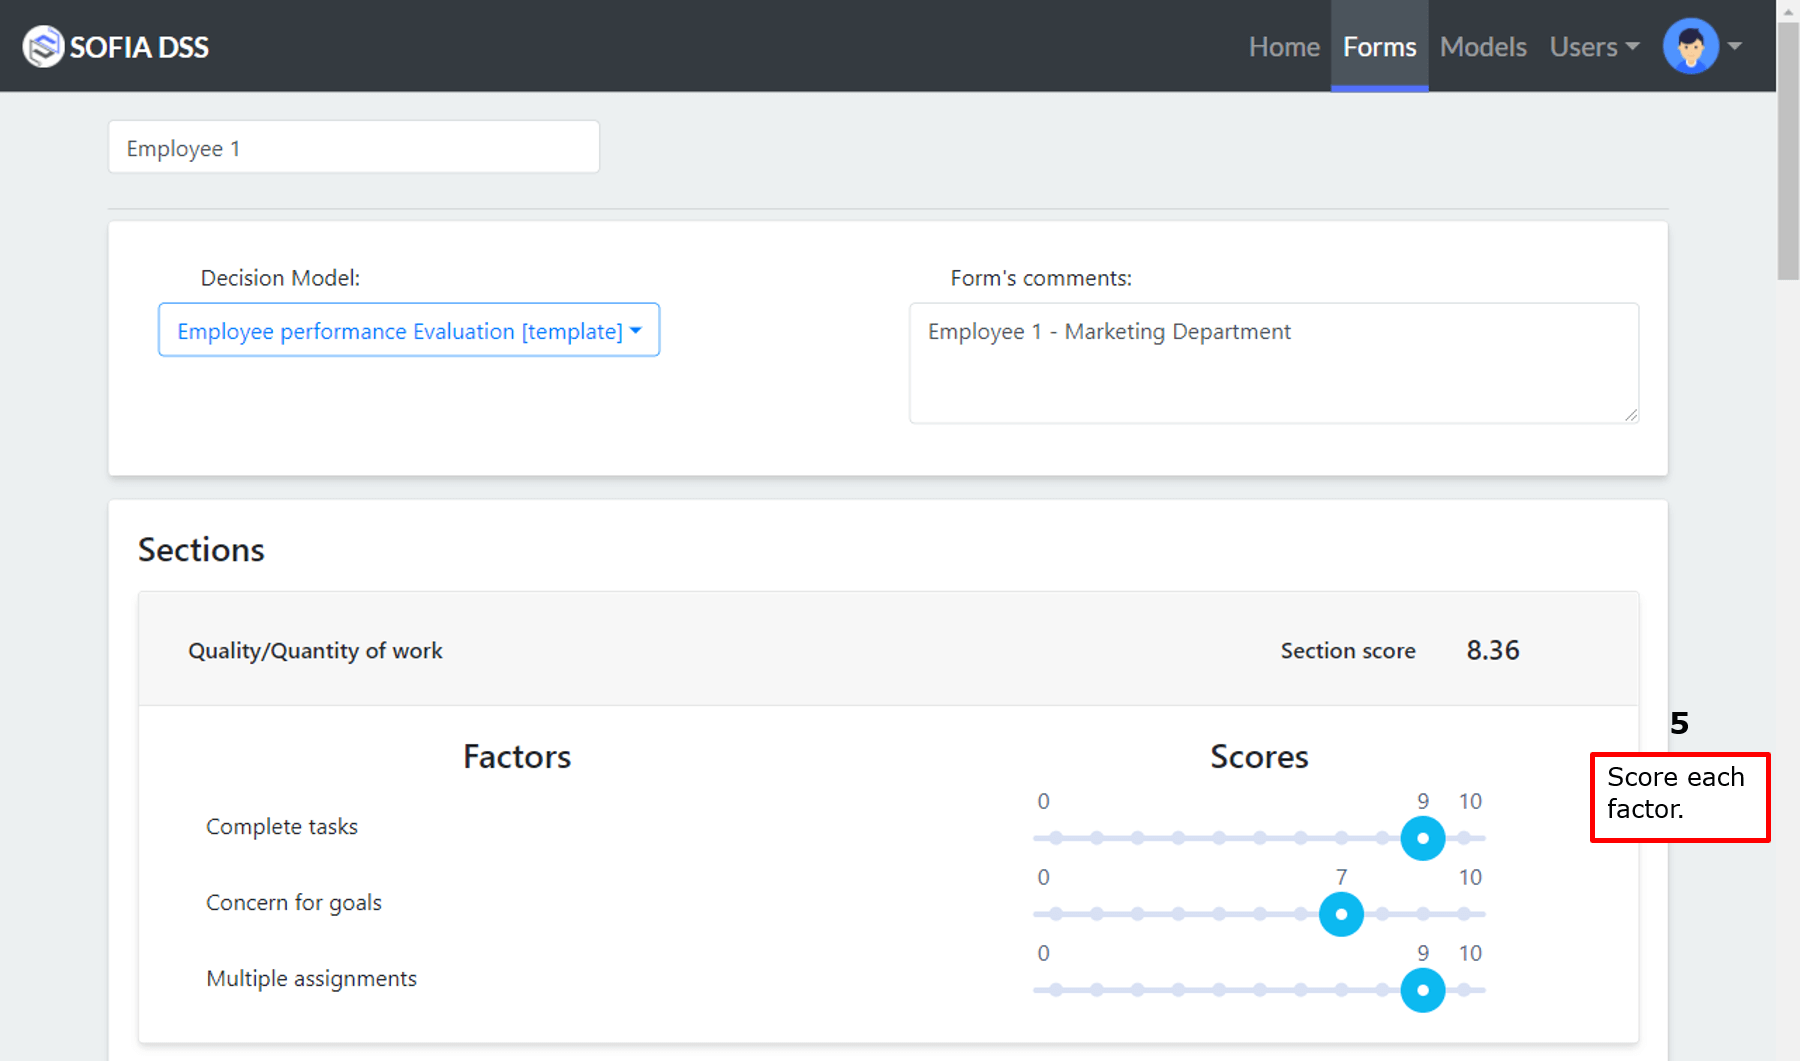
Picture 11: Score Factors.
The factors shown in Picture 11, hold the weights of the selected model. The weights determine the importance of each factor in this particular evaluation model.
In this step you enter some scores to assess each factor, considering the specific use case you are evaluating. When you finish, scroll down to assess the factors of each section, click “Calculate” and you’ll receive a weighted average of the scores you just entered, considering the model’s weights.
A Bar chart and a Spider chart at the bottom of the page will also appear that visualize the weighted scores for each factor.
Repeat the process of creating a decision form as many times as your specific case requires. For example, if you have to evaluate the performance of 10 employees of the same department, you will create 10 decision forms, concerning the same decision model.
Compare Forms
In Pictures 12 and 13 below, we are comparing 2 employees, which means that the 2 forms already appear, representing the 2 employees. The system allows you to put both forms side by side and compare your evaluations by following the steps 1 to 4. Keep in mind that you can create and compare as many forms as you need, depending on the number of your employees or candidates.

Picture 12: Compare Forms.

Picture 13: Choose the decision forms for comparison.
An Aggregation table with the weighted scores of each form’s factors should appear next, as shown in Picture 14, together with 2 comparison chart types, that provide comparative results of the 2 forms, as shown in Pictures 15 and 16. The spider chart is used for management of small data volume whereas the bar chart for management of great data volume.
The table also shows a third column called “Aggregated data”, which represents the average scores across both forms. This aggregation can be exported as a new form, by clicking the “Create aggregation” button.
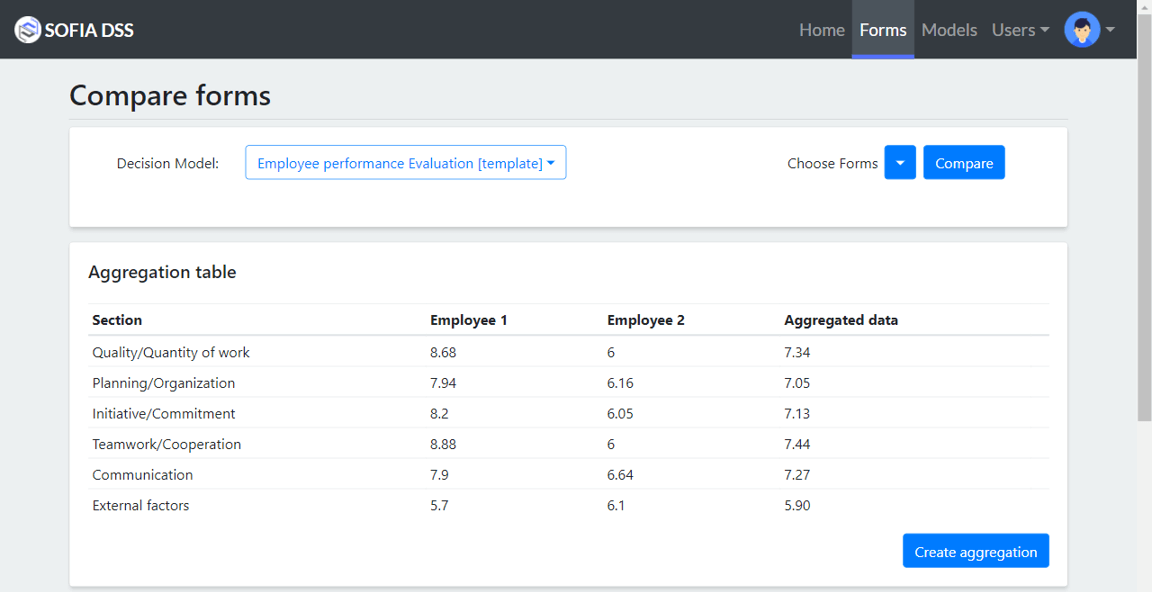
Picture 14: Aggregation table.
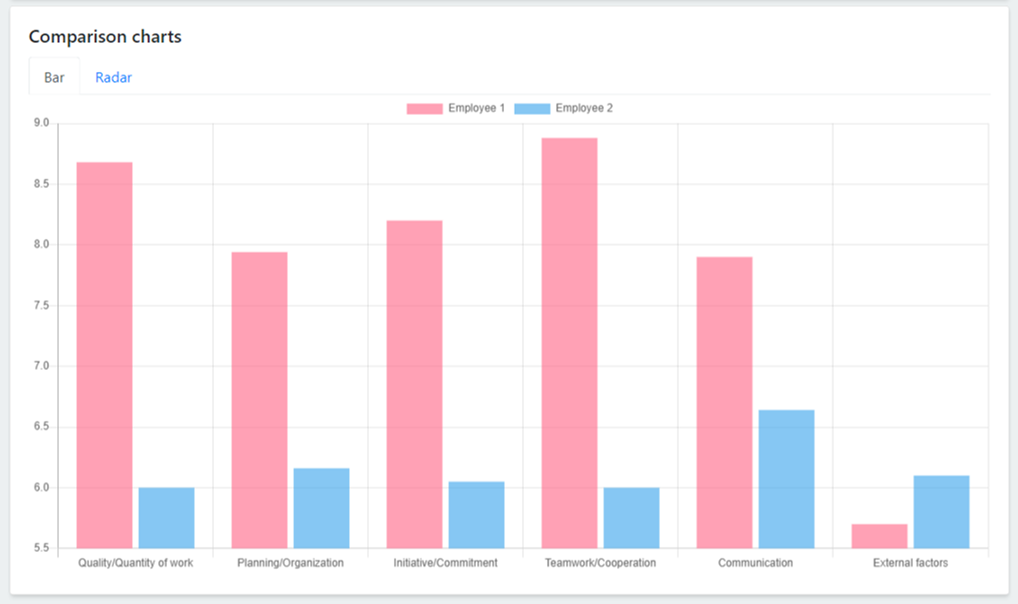
Picture 15: Bar Chart.
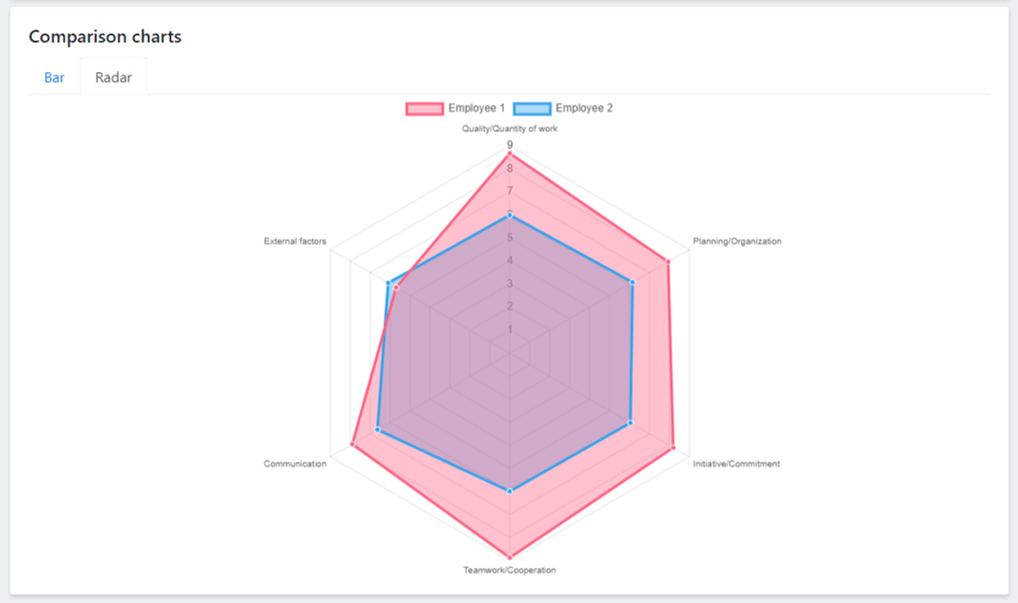
Picture 16: Radar Chart.
